Showing posts with label euro. Show all posts

Friday, July 1, 2016

Warning: This Could Be the Start of a Global Banking Crisis

By Justin Spittler

Europe’s banking system is collapsing. Over the past year, shares of Deutsche Bank (DB), Germany’s biggest bank, have plunged 56%. Swiss banking giant Credit Suisse (CS) is down 62% over the same period. Yesterday, both stocks hit record lows.

Dozens of other European bank stocks have also crashed. The Euro STOXX Banks, which tracks 48 of Europe’s largest banks, is down 48% over the past year. This is a major issue. That's because banks are the cornerstone of the financial system. They keep money flowing through the economy. If they’re struggling, it often means the economy is having major problems. Right now, European banks are flashing bright warning signs. That’s not just bad news for Europe—it’s also a serious threat to the rest of the world.

In today’s Dispatch, we’ll show you why Europe’s banking crisis could turn into a global banking crisis. You’ll also learn how to transform this threat into a chance to make big gains.

European banks are struggling to make money..…
Spanish banking giant BBVA’s (BBVA) profits fell 54% last quarter. First quarter profits at Deutsche Bank were down 58%. Swiss bank UBS’s (UBS) profits plunged 64%. European banks are hurting for a couple reasons. One, Europe is growing at the slowest pace in decades. Banks are making fewer loans as a result.

Two, negative interest rates are eating European banks alive. If you’ve been reading the Dispatch, you know negative rates are the latest radical government policy. They basically flip your bank account upside down. Instead of earning interest for keeping money in the bank, you pay the bank to hold your money.

Negative rates are clearly bad for savers. They’re also hurting Europe's biggest banks. That’s because these huge institutions have to pay their “bank,” the European Central Bank (ECB). Today, European banks pay £4 for every £1,000 they store at the ECB for a year. That might not sound like a lot. But it adds up quick when you manage trillions of euros like these banks do.

Last week, investors got another reason to avoid European banks..…
On Thursday, Great Britain voted to leave the European Union (EU), which it’s been in since 1973.
The “Brexit,” as the media is calling it, blindsided investors. As we explained yesterday, the market was expecting Great Britain to stay in EU. The unexpected outcome triggered a global stock market crash.

U.S. stocks had their worst day since August. Japanese stocks had their worst day in five years. European stocks had their biggest decline since the 2008 financial crisis. Friday’s global selloff erased $2.1 trillion in value from global stocks. It was the global stock market’s worst day in history. The panic didn’t die down much over the weekend. By the end of Monday, another $930 billion had disappeared from the global stock market.

European bank stocks were hit the hardest..…
Deutsche Bank plunged 22% between Friday and Monday. Credit Suisse fell 23%. UBS fell 20%. Barclays (BCS) and Royal Bank of Scotland (RBS) each plunged 37%. Both stocks are down more than 57% over the past year. These are gigantic moves in a matter of days. Remember, we’re not talking about small biotech stocks. These are some of the most important financial institutions on the planet.

Government officials are scrambling to contain the crisis..…
Today, the Bank of England (BoE) injected £3.1 billion into Britain’s banking system. It’s pledged to inject as much as £250 billion to stabilize its financial system. The BoE made its cash injection hours after the Bank of Japan (BOJ) pumped $1.5 billion into its banking system. As we'll show you in a second, we don't believe this will end well. That's because this excessive money printing (sometimes called "quantitative easing") doesn't stimulate the economy like governments intend it to.

Credit Suisse says other central banks could soon print more money too. Bloomberg Business reported on Friday:
“Market liquidity and overall liquidity in the U.K. is drying up as we speak in a very rapid way,” said John Woods, chief investment officer for Asia-Pacific at Credit Suisse Private Banking, told Bloomberg TV in Hong Kong. “It’s highly likely that we see monetary easing in a coordinated response” from central banks across the world, he said.
Great Britain is headed for a recession..…
A recession is when an economy shrinks two quarters in a row. Goldman Sachs (GS) says Britain could be in a recession by early 2017. But here’s the thing. We don’t think the BoE will let this happen. That’s because central bankers will do anything, including using reckless, unproven monetary policies, to avoid a recession these days.

Credit rating agency Standard & Poor’s agrees with us. Reuters reported today:
"Brexit is likely to represent a drag of about 1.2 percent of GDP for the UK in 2017," Jean-Michel Six, S&P's chief economist for Europe, the Middle East and Africa told a conference call for investors on Tuesday. "We have a significant slowdown but growth remains positive although obviously in a much more disappointing way. That is because we anticipate a very strong monetary response on the part of the Bank of England, in the form of additional quantitative easing, in the form of a further cut in interest rates," he added.
Bank of America (BAC) and Deutsche Bank also expect the BoE to fire up the printing press again. Bank of America says it could happen as soon as August.

QE won’t help Great Britain’s economy..…
As we told you above, QE doesn’t work. As regular readers know, the Federal Reserve pumped $3.5 trillion into the U.S financial system after the 2008 financial crisis. This massive money printing effort was supposed to juice the economy. But the U.S. is growing at its slowest pace since World War II. QE also failed to jumpstart Japan’s economy, which hasn’t grown in two decades. There’s no reason to think it will work this time.

If you’re nervous about the global financial system, we encourage you to take action today.…
The first thing you should do is own physical gold. Gold is real money. It’s held its value for thousands of years because it has a unique set of attributes: It’s easy to transport, easily divisible, and durable. You can take a gold coin anywhere in the world and folks will immediately recognize its value.

Unlike paper money, central bankers cannot create gold from nothing. It’s the ultimate antidote to crumbling paper currencies. That’s why the price of gold often soars when governments print money. This year, gold is up 24%. It’s trading at the highest price in two years. But it could go much higher as governments continue to run reckless monetary experiments.

If you want big profits from rising gold prices, own gold stocks..…
Dispatch readers know gold miners are leveraged to the price of gold. A small jump in the price of gold can cause gold stocks to surge. Gold’s 24% jump this year has caused GDX, a fund that tracks large gold stocks, to soar 96%. We believe this gold stock rally is just getting started. During the 2000 and 2003 gold bull market, the average gold stock gained 602%. The best ones soared 1,000% or more.

Nick Giambruno, editor of Crisis Investing, has recommended two gold stocks this year..…
He already closed out one of them for a quick double. It surged 103% in 14 months. Nick’s other gold stock is up 30% since March and is still dirt cheap at today's levels. Nick currently rates this stock a "Buy"…and says it could soon start paying a double digit dividend yield if gold keeps rising.

You can learn more about Nick’s gold stock by taking advantage of our special 60%-off sale for Crisis Investing. If you sign up today, you’ll be enrolled in a trial membership, which gives you 90 days risk-free to decide if the service is for you. But we encourage you to act soon. This special offer ends soon, and we likely won’t open this offer again for a long time.

You can learn more about this incredible offer by watching this video presentation. You’ll also learn about an even bigger threat to your wealth than Europe’s banking crisis. As you’ll see, almost no one is talking about this coming crisis. Yet, it could cause millions of Americans to lose their entire life savings. By the end of this video, you’ll know how to protect yourself. And just as importantly, you’ll know how to profit from this coming crisis. Click here to watch this free video.

Chart of the Day

U.S. bank stocks are also headed lower. Today’s chart shows the performance of the Financial Select Sector SPDR ETF (XLF) over the past year. XLF holds 94 major U.S. financial companies including behemoths JPMorgan Chase (JPM), Wells Fargo (WFC), and Bank of America (BAC). You can see XLF is down 11% since last June. While that's not as severe as the near 50% drop in European banks over the same period, it's still a clear sign to stay away.

U.S. banks have many of the same problems as European banks. Like Europe, the U.S. economy is growing at the slowest pace in decades. And while the U.S. economy doesn’t have negative rates yet, Fed Chair Janet Yellen has said they aren’t “off the table” if the U.S. economy runs into trouble. The arrival of negative rates to the U.S. could tip bank stocks into a crisis, just like they have in Europe.


Get our latest FREE eBook "Understanding Options"....Just Click Here!

Stock & ETF Trading Signals

Monday, September 7, 2015

Currency Market Summary for Week Ending Friday September 4th

The December Dollar closed lower on Friday but remains above the 20 day moving average crossing at 96.29. The high range close sets the stage for a steady to higher opening when Tuesday's night session begins trading. Stochastics and the RSI are neutral to bullish signaling that sideways to higher prices are possible near term. If December extends the rally off August's low, the reaction high crossing at 97.40 is the next upside target. First resistance is the reaction high crossing at 97.04. Second resistance is August's high crossing at 98.74. First support is August's low crossing at 92.85. Second support is the 75% retracement level of the 2014-2015 rally crossing at 92.36.

Sign up for this weeks "500k Proof and Plan Webinar"

The December Euro closed higher due to short covering on Friday but remains below the 20 day moving average crossing at 112.26. The mid range close sets the stage for a steady opening when Tuesday's night session begins trading. Stochastics and the RSI are neutral to bearish signaling that sideways to lower prices are possible near term. If December extends this week's decline, the reaction low crossing at 110.39 is the next downside target. First resistance is August's high crossing at 117.30. Second resistance is the 38% retracement level of the 2014-2015 decline crossing at 118.34. First support is the reaction low crossing at 110.39. Second support is August's low crossing at 108.73.

The December British Pound closed lower on Friday as it extended its decline off August's high. The low range close sets the stage for a steady to lower opening when Tuesday's night session begins trading. Stochastics and the RSI are oversold but remain neutral to bearish signaling that sideways to lower prices are possible near term. If December extends the aforementioned decline, the 62% retracement level of the April-June-rally crossing at 1.5110 is the next downside target. Closes above the 20 day moving average crossing at 1.5516 would confirm that a short term low has been posted. First resistance is the 10 day moving average crossing at 1.5406. Second resistance is the 20 day moving average crossing at 1.5516. First support is today's low crossing at 1.5159. Second support is the 62% retracement level of the April-June rally crossing at 1.5110.

The December Swiss Franc posted an inside day with a higher close on Friday as it consolidates some of the decline off August's high. The high range close sets the stage for a steady to higher opening when Tuesday's night session begins trading. Stochastics and the RSI are oversold but remain neutral to bearish signaling that sideways to lower prices are possible near term. If December extends the decline off August's high, the reaction low crossing at 1.0248 is the next downside target. Closes above the 10 day moving average crossing at 1.0460 would confirm that a short term low has been posted. First resistance is the 10 day moving average crossing at 1.0460. Second resistance is August's high crossing at 1.0842. First support is the reaction low crossing at 1.0248. Second support is August's low crossing at 1.0147.

The December Canadian Dollar closed lower on Friday. The low range close sets the stage for a steady to lower opening when Tuesday's night session begins trading. Stochastics and the RSI are turning neutral to bearish signaling that sideways to lower prices are possible near term. If December resumes the decline off May's high, weekly support crossing at 73.92 is the next downside target. Closes above the reaction high crossing at 77.10 are needed to confirm that a low has been posted. First resistance is the reaction high crossing at 77.10. Second resistance is the reaction high crossing at 77.68. First support is August's low crossing at 74.87. Second support is weekly support crossing at 73.92.

The December Japanese Yen closed higher on Friday as it extends this week's rally. The high range close sets the stage for a steady to higher opening when Tuesday's night session begins trading. Stochastics and the RSI have turned neutral to bullish signaling that sideways to higher prices are possible near term. If December renews the rally off August's low, August's high crossing at .8603 is the next upside target. Closes below the 20 day moving average crossing at .8212 are needed to confirm that a short term top has been posted. First resistance is August's high crossing at .8603. Second resistance is January's high crossing at .8653. First support is the 10 day moving average crossing at .8349. Second support is the 20 day moving average crossing at .8212.

Get out latest FREE eBooK "Understanding Options"....Just Click Here

Sunday, August 30, 2015

Currency Market Summary for Week Ending Friday August 28th

The September Dollar closed higher due to short covering on Friday as it extends the rally off August's low. The high range close sets the stage for a steady to higher opening when Monday's night session begins trading. Stochastics and the RSI are neutral to bullish signaling that sideways to higher prices are possible near term. Closes above the 20 day moving average crossing at 96.45 are needed to confirm that a low has been posted. If September resumes the decline off August's high, the 62% retracement level of the 2014-2015 rally crossing at 91.04 is the next downside target. First resistance is the 20 day moving average crossing at 95.45. Second resistance is the reaction high crossing at 97.11. First support is Monday's low crossing at 92.52. Second support is the 62% retracement level of the 2014-2015 rally crossing at 91.04.

John Carters "Big Trade Video" is still making news....Just Click Here

The September Euro closed lower on Friday as it extends this week's decline. The low range close sets the stage for a steady to lower opening when Monday's night session begins trading. Stochastics and the RSI are neutral to bearish signaling that sideways to lower prices are possible near term. Closes below the 20 day moving average crossing at 111.40 are needed to confirm that a short term top has been posted. If September renews the rally off July's low, the 38% retracement level of the 2014-2015 decline crossing at 118.09 is the next upside target. First resistance is Monday's high crossing at 117.18. Second resistance is the 38% retracement level of the 2014-2015 decline crossing at 118.09. First support is the 20 day moving average crossing at 111.40. Second support is the reaction low crossing at 110.20.

The September British Pound closed lower on Friday as it extended its decline off Tuesday's high. The mid range close sets the stage for a steady to lower opening when Monday's night session begins trading. Stochastics and the RSI are oversold but remain neutral to bearish signaling that sideways to lower prices are possible near term. If September extends this week's decline, July's low crossing at 1.5323 is the next downside target. Closes above the 10 day moving average crossing at 1.5604 would confirm that a short term low has been posted. First resistance is Tuesday's high crossing at 1.5817. Second resistance is June's high crossing at 1.5924. First support is July's low crossing at 1.5323. Second support is June's low crossing at 1.5160.

The September Swiss Franc closed higher on Friday. The mid range close sets the stage for a steady opening when Monday's night session begins trading. Stochastics and the RSI are neutral to bearish signaling that sideways to lower prices are possible near term. Closes below the 20 day moving average crossing at 1.0333 are needed to confirm that a short term top has been posted. If September renews the rally off August's low, the 87% retracement level of the May-August decline crossing at 1.0922 is the next upside target. First resistance is Monday's high crossing at 1.0809. Second resistance is the 87% retracement level of the May-August decline crossing at 1.0922. First support is the 20 day moving average crossing at 1.0333. Second support is the reaction low crossing at 1.0213.

The September Canadian Dollar closed slightly higher due to short covering on Friday. The mid range close sets the stage for a steady opening when Monday's night session begins trading. Stochastics and the RSI are turning neutral to bullish hinting that a low might be in or is near. Closes above the reaction high crossing at 77.20 are needed to confirm that a low has been posted. If September extends the decline off May's high, weekly support crossing at 73.92 is the next downside target. First resistance is the reaction high crossing at 77.20. Second resistance is the reaction high crossing at 77.73. First support is Wednesday's low crossing at 74.93. Second support is weekly support crossing at 73.92.

The September Japanese Yen closed lower on Friday as it extends the correction off Monday's high. The low range close sets the stage for a steady to lower opening when Monday's night session begins trading. Stochastics and the RSI are neutral to bearish signaling that a short term top might be in or is near. Closes below the 20 day moving average crossing at .8126 are needed to confirm that a short term top has been posted. If September renews this month's rally, January's high crossing at .8640 is the next upside target. First resistance is Monday's high crossing at .8591. Second resistance is January's high crossing at .8640. First support is the 10 day moving average crossing at .8216. Second support is the 20 day moving average crossing at .8126.

Get out latest FREE eBooK "Understanding Options"....Just Click Here

Saturday, August 15, 2015

This Weeks Currency and Forex Market Summary - Dollar, Euro, Yen, Pound and more!

The September Dollar closed higher on Friday as it consolidated some of the decline off last Friday's high. The high range close sets the stage for a steady to higher opening when Monday's night session begins trading. Stochastics and the RSI are neutral to bearish signaling that sideways to lower prices are possible near term. If September renews the decline off August's high, the reaction low crossing at 95.55 is the next downside target. Closes above the 20 day moving average crossing at 97.33 would confirm that a low has been posted. First resistance is last Friday's high crossing at 98.42. Second resistance is the reaction high crossing at 99.16. First support is Wednesday's low crossing at 95.94. Second support is the reaction low crossing at 95.55.

Get out latest FREE eBooK "Understanding Options"....Just Click Here

The September Euro closed lower on Friday as it consolidated some of the rally off July's low. The low range close sets the stage for a steady to lower opening when Monday's night session begins trading. Stochastics and the RSI are neutral to bullish signaling that sideways to higher prices are possible near term. If September extends the rally off July's low, the reaction high crossing at 112.92 is the next upside target. Closes below the 20 day moving average crossing at 109.95 would temper the near term friendly outlook. First resistance is the reaction high crossing at 112.26. Second resistance is the reaction high crossing at 112.92. First support is August's low crossing at 108.52. Second support is July's low crossing at 108.28.

The September British Pound closed higher on Friday while extending the July-August trading range. The high range close sets the stage for a steady to higher opening when Monday's night session begins trading. Stochastics and the RSI are neutral to bullish signaling that sideways to higher prices are possible near term. Closes above the reaction high crossing at 1.5669 are needed to renew the rally off July's low. If September resumes the decline off June's high, July's low crossing at 1.5323 is the next downside target. First resistance is the reaction high crossing at 1.5669. Second resistance is June's high crossing at 1.5924. First support is last Friday's low crossing at 1.5419. Second support is July's low crossing at 1.5323.

The September Swiss Franc closed steady on Friday. The mid range close sets the stage for a steady opening when Monday's night session begins trading. Stochastics and the RSI are neutral to bullish signaling that a low might be in or is near. Closes above the 20 day moving average crossing at 1.0309 are needed to confirm that a short term low has been posted. If September renews the decline off June's high, March's low crossing at 0.9966 is the next downside target. First resistance is the 20 day moving average crossing at 1.0309. Second resistance is the reaction high crossing at 1.0488. First support is Tuesday's low crossing at 1.0108. Second support is March's low crossing at 0.9966.

The September Canadian Dollar closed lower on Friday. The low range close sets the stage for a steady to lower opening when Monday's night session begins trading. Stochastics and the RSI are turning neutral to bullish signaling that sideways to higher prices are possible near term. If September extends this month's rally, the reaction high crossing at 77.73 is the next upside target. If September resumes the decline off May's high, weekly support crossing at 73.92 is the next downside target. First resistance is the reaction high crossing at 77.73. Second resistance is the reaction high crossing at 78.96. First support is last Wednesday's low crossing at 75.66. Second support is weekly support crossing at 73.92.

The September Japanese Yen closed higher on Friday. The mid range close sets the stage for a steady opening when Monday's night session begins trading. Stochastics and the RSI are neutral to bullish hinting that a low might be in or is near. Closes above the 20 day moving average crossing at .8056 are needed to confirm that a short term low has been posted. If September resumes the decline off July's high, June's low crossing at .7956 is the next downside target. First resistance is the 20 day moving average crossing at .8056. Second resistance is the reaction high crossing at .8134. First support is Wednesday's low crossing at .7984. Second support is June's low crossing at .7956.

Trading U.S. Dollar ETF UUP? Get our free Trend Analysis....Just Click Here

Friday, May 15, 2015

Currency Market Summary for Week Ending Friday May 15th

The June U.S. Dollar closed lower on Friday as it extends the decline off April's high. The low range close sets the stage for a steady to lower opening when Monday's night session begins trading. Stochastics and the RSI are oversold but remain neutral to bearish signaling that sideways to lower prices are possible near term. If June extends the decline off April's high, the 38% retracement level of the June-March rally crossing at 92.90 is the next downside target. Closes above the 20 day moving average crossing at 95.62 are needed to confirm that a short term low has been posted. First resistance is the 10 day moving average crossing at 94.48. Second resistance is the 20 day moving average crossing at 95.62. First support is Thursday's low crossing at 93.15. Second support is the 38% retracement level of the June-March rally crossing at 92.90.

Get out latest FREE eBooK "Understanding Options"....Just Click Here

The June Euro closed higher on Friday as it extends the rally off April's low. The high range close sets the stage for a steady to higher opening when Monday's night session begins trading. Stochastics and the RSI are overbought but remain neutral to bullish signaling that sideways to higher prices are possible near term. If June extends the rally off April's low, February's high crossing at 115.46 is the next upside target. Closes below the 20 day moving average crossing at 111.09 would confirm that a short term top has been posted. First resistance is today's high crossing at 114.72. Second resistance is the February's high crossing at 115.46. First support is the 20 day moving average crossing at 111.09. Second support is the reaction low crossing at 110.72.

The June British Pound closed lower due to profit taking on Friday as it consolidates some of the rally off April's low. The low range close sets the stage for a steady to lower opening when Monday's night session begins trading. Stochastics and the RSI are overbought but remain neutral to bullish signaling that sideways to higher prices are possible near term. If June extends the rally off April's low, the 62% retracement level of the July-April decline crossing at 1.6121 is the next upside target. Closes below the 20 day moving average crossing at 1.5313 would confirm that a short term top has been posted. First resistance is the 50% retracement level of the July-April decline crossing at 1.5823. Second resistance is the 62% retracement level of the July-April decline crossing at 1.6121. First support is the 10 day moving average crossing at 1.5472. Second support is the 20 day moving average crossing at 1.5313.

The June Swiss Franc closed lower on Friday. The high range close sets the stage for a steady to higher opening when Monday's night session begins trading. Stochastics and the RSI are diverging but are neutral to bullish signaling that sideways to higher prices are possible near term. If June renews the rally off April's low, the 62% retracement level of the January-March decline crossing at 1.1189 is the next upside target. Closes below the 20 day moving average crossing at 1.0691 would confirm that a short term top has been posted. First resistance is the reaction high crossing at 1.1037. Second resistance is the 62% retracement level of the January-March decline crossing at 1.1189. First support is the 20 day moving average crossing at 1.0691. Second support is the reaction low crossing at 1.0437.

The June Canadian Dollar closed lower due to profit taking on Friday. The mid range close sets the stage for a steady opening when Monday's night session begins trading. Stochastics and the RSI are diverging and are turning neutral to bearish signaling that a short term top might be in or is near. Closes below the 20 day moving average crossing at 82.60 are needed to confirm that a short term top has been posted. If June renews the rally off March's low, the 38% retracement level of the 2013-2015 decline crossing at 84.82 is the next upside target. First resistance is Thursday's high crossing at 83.86. Second resistance is the 38% retracement level of the 2013-2015 decline crossing at 0.8482. First support is the 20-day moving average crossing at 82.60. Second support is the reaction low crossing at 81.20.

The June Japanese Yen closed slightly lower on Friday. The high range close sets the stage for a steady to higher opening when Monday's night session begins trading. Stochastics and the RSI are neutral to bullish signaling that sideways to higher prices are possible near term. Closes above March's high crossing at .8460 are needed to renew the rally off March's low. Closes below the reaction low crossing at .8301 would open the door for additional weakness near term. First resistance is March's high crossing at .8460. Second resistance is February's high crossing at .8562. First support is April's low crossing at .8280. Second support is March's low crossing at .8205.

Wednesday, February 25, 2015

Mid Week Currency and Forex Market Summary - Dollar, Franc, Yen, Pound, Euro

The March Dollar closed lower on Wednesday as it extends the trading range of the past four weeks. The low range close sets the stage for a steady to lower opening when Thursday's night session begins trading. Stochastics and the RSI are turning neutral to bearish signaling that sideways to lower prices are possible near term. Closes below the reaction low crossing at 93.38 are needed to confirm that a short term top has been posted and would open the door for additional weakness near term. If March renews the rally off October's low, weekly resistance crossing at 96.16 is the next upside target. First resistance is January's high crossing at 95.85. Second resistance is weekly resistance crossing at 96.16. First support is the reaction low crossing at 93.38. Second support is the reaction low crossing at 91.49.

Watch a Replay of this Weeks Free Trading Webinar....Just Click Here

The March Euro closed slightly higher on Wednesday as it extends the trading range of the past four weeks. The mid-range close sets the stage for a steady opening when Thursday's night session begins trading. Stochastics and the RSI are neutral to bearish signaling that sideways to lower prices are possible near term. If March renews this winter's decline, monthly support crossing at 107.59 is the next downside target. Closes above the reaction high crossing at 115.39 are needed to confirm that a short term low has been posted. First resistance is the reaction high crossing at 115.39. Second resistance is the reaction high crossing at 118.78. First support is January's low crossing at 111.02. Second support is weekly support crossing at 107.59.

The March British Pound closed higher on Wednesday as it extends the rally off January's low. The high range close sets the stage for a steady to higher opening when Thursday's night session begins trading. Stochastics and the RSI are overbought but remain neutral to bullish signaling that sideways to higher prices are possible near term. If March extends this month's rally, the 38% retracement level of the June-January decline crossing at 1.5775 is the next upside target. Closes below the 20 day moving average crossing at 1.5288 would temper the near term friendly outlook. First resistance is today's high crossing at 1.5537. Second resistance is the 38% retracement level of the June-January decline crossing at 1.5775. First support is the 10 day moving average crossing at 1.5407. Second support is the 20 day moving average crossing at 1.5288.

The March Swiss Franc closed slightly higher on Wednesday. The high range close sets the stage for a steady to higher opening when Thursday's night session begins trading. Stochastics and the RSI are oversold but remain neutral to bearish signaling that sideways to lower prices are possible near term. If March extends the decline off January's high, the 75% retracement level of January's rally crossing at 1.0399 is the next downside target. Closes above the 20 day moving average crossing at 1.0752 would confirm that a low has been posted. First resistance is the 10 day moving average crossing at 1.0636. Second resistance is the 20 day moving average crossing at 1.0752. First support is last Friday's low crossing at 1.0497. Second support is the 75% retracement level of January's rally crossing at 1.0399.

The March Canadian Dollar closed higher on Wednesday while extending this month's trading range. The high range close sets the stage for a steady to higher opening when Thursday's night session begins trading. Stochastics and the RSI are turning neutral to bullish signaling that sideways to higher prices are possible near term. If March renews this month's rally, the 25% retracement level of the 2013-2015 decline crossing at 82.65 is the next upside target. If March resumes this winter's decline, monthly support crossing at 76.53 is the next downside target. First resistance is last Tuesday's high crossing at 80.87. Second resistance is the 25% retracement level of the 2013-2015 decline crossing at 82.65. First support is January's low crossing at 78.08. Second support is monthly support crossing at 76.53.

The March Japanese Yen closed slightly higher on Wednesday as it extends a three month old trading range. The mid range close sets the stage for a steady opening when Thursday's night session begins trading. Stochastics and the RSI are neutral to bullish signaling that sideways to higher pirces are possible near term. Closes above the 20 day moving average crossing at .8438 would temper the near term bearish outlook. If March renews the decline off January's high, the reaction low crossing at .8282 is the next downside target. First resistance is the 20 day moving average crossing at .8442. Second resistance is December's high crossing at .8663. First support is the reaction low crossing at .8282. Second support is December's low crossing at .8219.

Get out latest FREE eBooK "Understanding Options"....Just Click Here


Sunday, January 18, 2015

Currency Market Summary and Recap for Week Ending January 16th - Dollar, Franc, Euro, Pound, Yen


The March U.S. Dollar closed higher on Friday as it extends this winter's rally. The mid range close sets the stage for a steady to higher opening when Tuesday's night session begins trading. Stochastics and the RSI are overbought, diverging and are turning neutral to bearish signaling that a short term top might be in or is near. Closes below the 20 day moving average crossing at 91.29 would confirm that a short term top has been posted. If March extends the rally off October's low, weekly resistance crossing at 94.32 is the next upside target. First resistance is today's high crossing at 93.56. Second resistance is weekly resistance crossing at 94.32. First support is the 10 day moving average crossing at 92.28. Second support is the 20 day moving average crossing at 91.29.

We have activated the free "Dynamic Swing Trader"....Just Click Here

The March Euro closed lower on Friday as it extends this winter's decline. The mid range close sets the stage for a steady opening when Tuesday's night session begins trading. Stochastics and the RSI are oversold but remain neutral to bearish signaling that sideways to lower prices are possible near term. If March extends this winter's decline, monthly support crossing at 112.75 is the next downside target. Closes above the 20 day moving average crossing at 119.87 would confirm that a short term low has been posted. First resistance is the 10 day moving average crossing at 117.96. Second resistance is the 20 day moving average crossing at 119.75. First support is today's low crossing at 114.67. Second support is weekly support crossing at 112.75.

The March British Pound closed lower on Friday. The mid range close sets the stage for a steady to lower opening when Tuesday's night session begins trading. Stochastics and the RSI are neutral signaling that sideways trading is possible near term. If March extends the decline off July's high, monthly support crossing at 1.4806 is the next downside target. Closes above the 20 day moving average crossing at 1.5351 are needed to confirm that a low has been posted. First resistance is Thursday's high crossing at 1.5261. Second resistance is the 20 day moving average crossing at 1.5351. First support is last Thursday's low crossing at 1.5027. Second support is monthly support crossing at 1.4806.

The March Swiss Franc closed higher on Friday as it extended Thursday's huge rally. The high range close sets the stage for a steady to higher opening when Tuesday's night session begins trading. Stochastics and the RSI are bullish signaling that sideways to higher prices are possible near term. If March extends this week's rally, monthly resistance crossing at 1.2503 is the next upside target. Closes below the 20 day moving average crossing at 1.0172 would confirm that a short term top has been posted. First resistance is Thursday's high crossing at 1.1862. Second resistance is monthly resistance crossing at 1.2503. First support is Wednesday's low crossing at 0.9777. Second support is monthly support crossing at 0.9421.

The March Canadian Dollar closed slightly higher on Friday. The high range close sets the stage for a steady to higher opening when Tuesday's night session begins trading. Stochastics and the RSI are oversold but remain neutral to bearish signaling that sideways to lower prices are possible near term. If March extends this winter's decline, monthly support crossing at 80.30 is the next downside target. Closes above the 20 day moving average crossing at 84.90 are needed to confirm that a low has been posted. First resistance is the 20 day moving average crossing at 84.90. Second resistance is the reaction high crossing at 86.33. First support is today's low crossing at 82.90. Second support is monthly support crossing at 80.30.

The March Japanese Yen closed lower on Friday marking a downside reversal. The low range close sets the stage for a steady to lower opening when Tuesday's night session begins trading. Stochastics and the RSI are overbought and are turning neutral to bearish hinting that a short term top might be in or is near. Closes below the 20 day moving average crossing at .8398 would confirm that a short term top has been posted. If March extends this week's rally, December's high crossing at .8663 is the next upside target. First resistance is December's high crossing at .8663. Second resistance is the 25% retracement level of the 2013-2014 decline crossing at .8773. First support the reaction low crossing at .8282. Second support is December's low crossing at .8219.

Get out latest FREE eBooK "Understanding Options"....Just Click Here


Saturday, January 3, 2015

Extreme Currency Market Summary for Week Ending January 2nd

The March U.S. Dollar gapped up and closed higher on Friday as it extends last year's rally. The high range close sets the stage for a steady to higher opening when Monday's night session begins trading. Stochastics and the RSI are overbought but remain neutral to bullish signaling that sideways to higher prices are possible near-term. If March extends the rally off October's low, weekly resistance crossing at 92.53 is the next upside target. Closes below the 20-day moving average crossing at 89.60 would confirm that a short term top has been posted. First resistance is today's high crossing at 91.43. Second resistance is weekly resistance crossing at 92.53. First support is the 20 day moving average crossing at 89.60. Second support is December's low crossing at 87.83.

Get our latest FREE eBooK "Understanding Options"....Just Click Here

The March Euro closed sharply lower on Friday as it extends last year's decline. The low range close sets the stage for a steady to lower opening when Monday's night session begins trading. Stochastics and the RSI are oversold but remain neutral to bearish signaling that sideways to lower prices are possible near term. If March extends last year's decline, monthly support crossing at 118.74 is the next downside target. Closes above the 20 day moving average crossing at 122.87 would confirm that a short term low has been posted. First resistance is the 20 day moving average crossing at 122.87. Second resistance is December's high crossing at 125.79. First support is today's low crossing at 120.09. Second support is weekly support crossing at 118.74.

The March British Pound closed sharply lower on Friday marking a downside breakout of the November-December trading range. The low range close sets the stage for a steady to lower opening when Monday's night session begins trading. Stochastics and the RSI are turning neutral to bearish with today's decline signaling that sideways to lower prices are possible near-term. If March extends the decline off July's high, monthly support crossing at 1.4806 is the next downside target. Closes above the 20 day moving average crossing at 1.5597 are needed to confirm that a low has been posted. First resistance is the 20 day moving average crossing at 1.5597. Second resistance is the reaction high crossing at 1.5776. First support is today's low crossing at 1.5318. Second support is monthly support crossing at 1.4806.

The March Swiss Franc closed lower on Friday as it extends last year's decline. The low range close sets the stage for a steady to lower opening when Monday's night session begins trading. Stochastics and the RSI are oversold but remain bearish signaling that sideways to lower prices are possible near term. If March extends last year's decline, monthly support crossing at 0.9824 is the next downside target. Closes above the 20-day moving average crossing at 1.0226 are needed to confirm that a low has been posted. First resistance is the 10 day moving average crossing at 1.0132. Second resistance is the 20 day moving average crossing at 1.0226. First support is today's low crossing at 0.9998. Second support is monthly support crossing at 0.9824.

The March Canadian Dollar closed sharply lower on Friday marking a downside breakout of December's trading range. The low range close sets the stage for a steady to lower opening when Monday's night session begins trading. Stochastics and the RSI turned neutral to bearish with today's decline signaling that sideways to lower prices are possible near term. If March extends last year's decline, monthly support crossing at 83.89 is the next downside target. Closes above the 20 day moving average crossing at 86.41 are needed to confirm that a low has been posted. First resistance is the 20 day moving average crossing at 86.41. Second resistance is November's high crossing at 89.12. First support is today's low crossing at 84.86. Second support is monthly support crossing at 83.89.

The March Japanese Yen closed lower on Friday. The low range close sets the stage for a steady to lower opening when Monday's night session begins trading. Stochastics and the RSI are oversold but remain neutral to bearish signaling that sideways to lower prices are possible near term. If March renews the decline off December's high, December's low crossing at .8219 is the next downside target. Closes above Tuesday's high crossing at .8419 are needed to confirm that a low has been posted. First resistance is December's high crossing at .8663. Second resistance is the 25% retracement level of the 2013-2014 decline crossing at .8773. First support is December's low crossing at .8219. Second support is weekly support crossing at .8171.


Monday, November 10, 2014

You Won't See This Ever Again....Finally, It's Being Unveiled

...EURJPY +57 pips
...AUDJPY +70 pips
...GBPUSD +202 pips
...Dow e-Mini +45 points
...Russell e-Mini +5.20 points
...Crude Oil +59 ticks
...Dax Futures +29.5 points
...Heating Oil +151 ticks

This was just a sample of a recent trading day with the NetPicks TrendJumper trading system.

Franklin Veras, an individual trader says..."NetPicks has consistently been the gold standard in providing trading education. From systems to signals, Forex, Futures, Stocks, Options & ETFs in day trading and swing trading – NetPicks concentrates on helping regular traders achieve success in the markets."

What if you could learn exactly what Franklin and over 1,000 other traders worldwide have found with the NetPicks Trend Jumper trading system? This includes most markets averaging 85% or higher in weekly profitability and some even 90%+ in daily profitability. With consistency like that it's hard to go wrong.

For the FINAL TIME, the Trend Jumper is being unveiled and demonstrated in a series of live webinars. You simply choose the date and time that works best for you. Don't miss this last chance at such a proven trading system.

Each webinar though is limited in space. Right now they are 47% full so there's still time but word is getting out so I highly suggest you reserve your spot now.....

Just click the link below for the time and day that works best for you.

Wednesday, November 12th @ 12pm EST/9am PST/5pm GMT

Wednesday, November 12th @ 6pm EST/3pm PST/11pm GMT

Thursday, November 13th @ 9am EST/6am PST/2pm GMT

Thursday, November 13th @ 3pm EST/12pm PST/8pm GMT

In addition, NetPicks has promised that every individual in attendance will receive an Active Traders Kit valued at $497 just for attending. I hear it includes a trading system, advanced trade tracking software and valuable trading education well beyond it's value.

See you in the markets,
Ray @ the Forex Market Club

P.S. Just like Franklin experienced above, Anthony Smith says "Thanks for Trend Jumper. It's ahead of its time. I'm always amazed at the accuracy of the trades and targets. It eliminates 95% of the emotional decision making process." Get yourself registered for the webinars to start experiencing this type of success.

Get out latest FREE eBooK "Understanding Options"....Just Click Here


Wednesday, September 3, 2014

Mid Week Currency Market Summary for Wednesday September 3rd

The December Dollar closed lower due to profit taking on Wednesday as it consolidates some of the rally off May's low. The low range close sets the stage for a steady to lower opening when Thursday's night session begins trading. Stochastics and the RSI are overbought but remain neutral to bullish signaling that sideways to higher prices are possible near term. If December extends the rally off May's low, weekly resistance crossing at 83.66 is the next upside target. Closes below the 20-day moving average crossing at 82.19 would confirm that a short term top has been posted. First resistance is today's high crossing at 83.19. Second resistance is weekly resistance crossing at 83.66. First support is the 10 day moving average crossing at 82.68. Second support is the 20 day moving average crossing at 82.19.

The December Euro closed higher due to short covering on Wednesday. The high-range close sets the stage for a steady to higher opening when Thursday's night session begins trading. Stochastics and the RSI are oversold but remain neutral to bearish signaling that sideways to lower prices are possible near term. If December extends this summer's decline, the 87% retracement level of the 2013-2014 rally crossing at 129.96 is the next downside target. Closes above the 20 day moving average crossing at 132.90 are needed to confirm that a low has been posted. First resistance is the 10 day moving average crossing at 132.02. Second resistance is the 20 day moving average crossing at 132.90. First support is Tuesday's low crossing at 131.19. Second support is the 87% retracement level of the 2013-2014 rally crossing at 129.96.

The December British Pound closed lower on Wednesday confirming yesterday's key reversal down. The low range close sets the stage for a steady to lower opening when Thursday's night session begins trading. Stochastics and the RSI are oversold but remain neutral to bearish signaling that sideways to lower prices are possible near term. If December extends the decline off July's high, the 38% retracement level of the 2013-2014 rally crossing at 1.6281 is the next downside target. Closes above the 20 day moving average crossing at 1.6633 would confirm that a low has been posted. First resistance is Tuesday's high crossing at 1.6629. Second resistance is the 20 day moving average crossing at 1.6633. First support is Wednesday's low crossing at 1.6426. Second support is the 38% retracement level of the 2013-2014 rally crossing at 1.6281.

The December Swiss Franc closed higher due to short covering on Wednesday. The high range close sets the stage for a steady to higher opening when Thursday's night session begins trading. Stochastics and the RSI are oversold but remain neutral to bearish signaling that sideways to lower prices are possible near term. If December extends the decline off July's high, the 62% retracement level of the 2013-2014 rally crossing at 1.0802 is the next downside target. Closes above the 20 day moving average crossing at 1.0986 would confirm that a low has been posted. First resistance is the 20-day moving average crossing at 1.0986. Second resistance is the reaction high crossing at 1.1090. First support is Tuesday's low crossing at 1.0869. Second support is the 62% retracement level of the 2013-2014 rally crossing at 1.0802.

The December Canadian Dollar closed higher due to short covering on Wednesday. The high range close sets the stage for a steady to higher opening when Thursday's night session begins trading. Stochastics and the RSI are neutral to bearish signaling that sideways to lower prices are possible near-term. Closes below last Tuesday's low crossing at 90.70 would confirm that a top has been posted. If December renews the rally off last Tuesday's low, the reaction high crossing at 93.04 is the next upside target. First resistance is last Friday's high crossing at 92.26. Second resistance is the reaction high crossing at 93.04. First support is last Tuesday'slow crossing at 90.70. Second support is the 62% retracement level of the March-July rally crossing at 89.67.

The December Japanese Yen closed higher due to short covering on Wednesday as it consolidates some of the decline off July's high. Today's high range close sets the stage for a steady to higher opening when Thursday's night session begins trading. Stochastics and the RSI are oversold but remain neutral to bearish signaling that sideways to lower prices are possible near-term. If December extends the decline off June's high, weekly support crossing at .9486 is the next downside target. Closes above the 20 day moving average crossing at .9697 would confirm that a short term low has been posted. First resistance is the 10 day moving average crossing at .9731. Second resistance is the 20 day moving average crossing at .9697. First support is Tuesday's low crossing at .9500. Second support is weekly support crossing at .9486. 

Make sure you get our new FREE options trading eBook "Understanding Options"


Sunday, July 6, 2014

Week Ending Currency Market Summary for Thursday July 3rd

The September Euro currency closed down 46 points at 1.3612 today. Prices closed nearer the session low and closed at a bearish weekly low close today. The Euro bulls and bears are on a level overall near term technical playing field but the bulls are fading.

The September Japanese Yen closed down 37 points at .9789 today. Prices closed nearer the session low today, hit a two week low and closed at a bearish weekly low close. The bulls have lost their slight near term technical advantage. A four week old uptrend on the daily bar chart was negated today.

The September Swiss Franc closed down 53 points at 1.1200 today. Prices closed near mid range, hit a two week low and closed at a bearish weekly low close today. The bulls have lost their near term technical advantage. A four week old uptrend on the daily bar chart was negated today.

The September Canadian Dollar closed up 33 points at .9389 today. Prices closed nearer the session high and scored a bullish outside day up on the daily bar chart. Prices also hit another seven month high and closed at a bullish weekly high close today. The bulls have the solid near term technical advantage. A three month old uptrend is in place on the daily bar chart.

The September British Pound closed down 11 points at 1.7142 today. Prices closed nearer the session high. The bulls have the solid overall near term technical advantage.

The September U.S. Dollar index closed up 0.270 at 80.255 today. Prices closed near mid range on short covering in a bear market. Prices did close at a bullish weekly high close today. The greenback bears still have the near term technical advantage.

Low VIX and What It Means to Your Trading....Our Next Free Webinar

Sunday, June 8, 2014

Are You Ready for Negative Interest Rate and Pay the Bank to Hold Your Money?

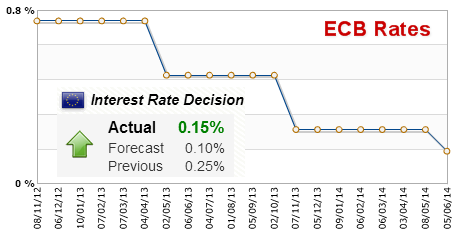
The six members of the European Central Bank (ECB) Executive Board and the 16 governors of the euro area central banks vote on where to set the rate. We watch interest rate changes closely as short term interest rates are the primary factor in currency valuation.
 

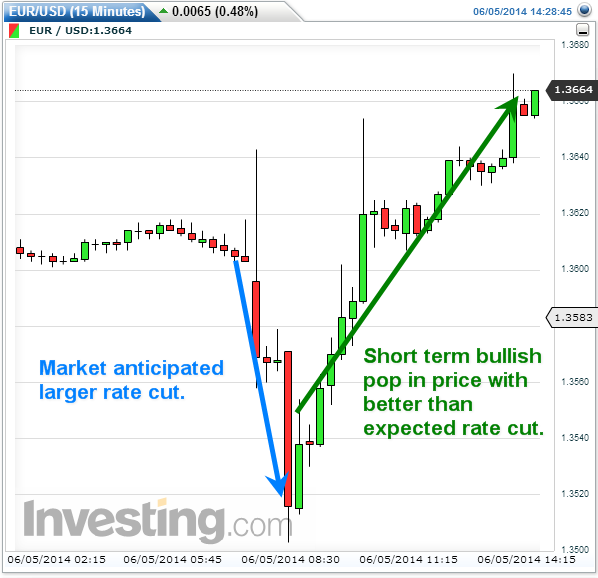
A higher than expected rate is positive for the EUR, while a lower than expected rate is negative for the EUR. Today (Thursday June 5th) we expected a rate cut. The cut was not as much as analysts expected which is bullish for the short term, but the rate is still declining and nearing zero, or even worse, negative territory.


ecbrates eurochart


A negative interest rate may sound crazy or impossible, but it's already happening in Denmark. Europe is already in a deflationary state and central banks are doing everything they can to bring about inflation by cutting rates and devaluing the euro. This will cause a ripple through multiple asset classes and will drastically alter the outcome of individuals worldwide. Just imagine if you had to pay a bank to hold your money and you do not earn any interest but rather pay interest.

People who have been saving their entire lives will get hit the hardest. Retired folks will stop earning money and start paying for all the money they hold held at banks. Individuals will go more into debt because money will be extremely cheap to borrow. Price of assets like equities, real estate, discretionary goods will rise because the cheap money everyone is borrowing will be used to buy more stuff. While all this happens everyone takes on more dept. It is a brutal spiral leading to increase debt levels, inflation and eventually bankruptcy.

If the euro dollar starts to decline at a quicker pace the U.S. dollar will likely rally. A strong dollar could affect the commodities market including gold, silver and the European stock markets. Todays rate cut led to a pop in the euro, but that is likely to be short lived. I hope this sheds some light on the markets and helps in your trading.

Chris Vermeulen

P.S. In the next few days members and myself will be looking to enter some trades based round this analysis. See Premium Trading Video & Newsletter

Sincerely,
Chris Vermeulen


Sign up for one of our Free Trading Webinars....Just Click Here!


Wednesday, April 23, 2014

Currency Market Summary for Wednesday April 23rd

The June Euro currency closed up 14 points at 1.3815 today. Prices closed nearer the session low today. The bulls still have the near term technical advantage. There is a stiff layer of chart resistance just above the 1.3900 level. There is also a bullish pennant pattern that has formed on the daily bar chart.

The June Japanese Yen closed up 20 points at .9766 today. Prices closed near mid-range today on short covering. The bears have the overall near term technical advantage.

The June Swiss Franc closed up 26 points at 1.1329 today. Prices closed near mid range. Bulls have the slight near- term technical advantage.

The June Canadian Dollar closed down 4 points at .9052 today. Prices closed nearer the session high and hit a fresh three week low again today. The bulls and bears are on a level near term technical playing field.

The June British Pound closed down 41 points at 1.6774 today. Prices closed nearer the session low and saw profit taking. The bulls still have the solid overall near term technical advantage.

The June U.S. Dollar index closed down 0.065 at 79.930 today. Prices closed nearer the session high today. The greenback bears still have the overall near term technical advantage. However, a bullish double bottom reversal pattern could be forming on the daily bar chart now.


Subscribe to our Free Market Technical Analysis and Commentary


Tuesday, February 25, 2014

Mid Week Currency and Forex Market Summary

The March U.S. Dollar closed lower on Tuesday. The mid range close sets the stage for a steady opening when Wednesday's night session begins trading. Stochastics and the RSI are turning neutral to bearish signaling that additional weakness is possible near term. If March resumes this month's decline, the reaction low crossing at 79.82 is the next downside target. Closes above the 20 day moving average crossing at 80.62 are needed to confirm that a short term low has been posted. First resistance is the 20 day moving average crossing at 80.62. Second resistance is the reaction high crossing at 80.91. First support is last Wednesday's low crossing at 79.95. Second support is the reaction low crossing at 79.82.

Get Your Free Forex Channel Trading System to trade over 20 Currency Pairs

The March Euro closed slightly higher on Tuesday. The mid range close sets the stage for a steady opening when Wednesday's night session begins trading. Stochastics and the RSI are overbought but remain neutral to bullish signaling that sideways to higher prices are possible near term. If March extends the aforementioned rally, the reaction high crossing at 138.34 is the next upside target. Closes below the 20 day moving average crossing at 136.42 would confirm that a short term top has been posted. First resistance is last Wednesday's high crossing at 137.73. Second resistance is the reaction high crossing at 138.34. First support is the 20 day moving average crossing at 136.42. Second support is the reaction low crossing at 135.62.

The March British Pound closed higher on Tuesday. The mid range close sets the stage for a steady opening when Wednesday's night session begins trading. Stochastics and the RSI are neutral to bearish hinting that a short term top might be in or is near. Closes below the 20 day moving average crossing at 1.6527 would confirm that a short term top has been posted. If March resumes the rally off February's low, monthly resistance crossing at 1.7043 is the next upside target. First resistance is last Tuesday's high crossing at 1.6821. Second resistance is monthly resistance crossing at 1.7043. First support is the 20 day moving average crossing at 1.6527. Second support is February's low crossing at 1.6247.

The March Swiss Franc closed higher on Tuesday. The high range close sets the stage for a steady to higher opening when Wednesday's night session begins trading. Stochastics and the RSI are overbought but remain neutral to bullish signaling that sideways to higher prices are possible near-term. If March extends this month's rally, December's high crossing at .11373 is the next upside target. Closes below the 20 day moving average crossing at .11165 would confirm that a short term top has been posted. First resistance is Monday's high crossing at .11301. Second resistance is December's high crossing at .11373. First support is the 10 day moving average crossing at .11222. Second support is the 20 day moving average crossing at .11165.

The March Canadian Dollar closed lower on Tuesday. The low range close sets the stage for a steady to lower opening when Wednesday's night session begins trading. Stochastics and the RSI are neutral to bearish signaling that sideways to lower prices are possible near term. If March renews last week's decline, this month's low crossing at 88.99 is the next downside target. Closes above the 10 day moving average crossing at 90.55 would temper the near-term bearish outlook. First resistance is last Wednesday's high crossing at 91.60. Second resistance is the 38% retracement level of the September-January decline crossing at 92.32 . First support is last Friday's low crossing at 89.27. Second support is this month's low crossing at 88.99.

The March Japanese Yen closed higher on Tuesday. Today's high range close sets the stage for a steady to higher opening when Wednesday's night session begins trading. Stochastics and the RSI are turning neutral to bullish signaling that a low might be in or is near. If March renews the rally off January's low, the 62% retracement level of the October-January decline crossing at .10026 is the next upside target. If March extends this month's decline, the reaction low crossing at .9672 is the next downside target. First resistance is the 50% retracement level of the October-January decline crossing at .9920. Second resistance is the 62% retracement level of the October-January decline crossing at .10026. First support is last Friday's low crossing at .9725. Second support is the reaction low crossing at .9672.

Get Your Free Forex Channel Trading System to trade over 20 Currency Pairs


Monday, January 6, 2014

FMC: Currency/Forex Market Summary for Monday January 6th

The March Dollar closed lower due to profit taking on Monday as it consolidates some of the rally off December's low. The low range close sets the stage for a steady to lower opening when Tuesday's night session begins trading. Stochastics and the RSI are neutral to bullish signaling that sideways to higher prices are possible near term. Closes above the reaction high crossing at 81.00 would renew the rally off December's low and open the door for additional gains during January. Closes below the 20 day moving average crossing at 80.46 would temper the near term friendly outlook. First resistance is the reaction high crossing at 81.00. Second resistance is December's high crossing at 81.18. First support is the 20 day moving average crossing at 80.46. Second support is December's low crossing at 79.50.

Get the complete Premier Trading University Free Training Webinar Schedule

The March Euro closed higher due to short covering on Monday as it consolidated some of last week's decline. Today's high range close sets the stage for a steady to higher opening when Tuesday's night session begins trading. Stochastics and the RSI are bearish signaling that sideways to lower prices are possible near term. If March extends last week's decline, the reaction low crossing at 135.26 is the next downside target. Closes above the 20 day moving average crossing at 137.16 are needed to confirm that a low has been posted. First resistance is the 20 day moving average crossing at 137.16. Second resistance is December's high crossing at 138.93. First support is today's low crossing at 135.71. Second support is the reaction low crossing at 135.26.

The March British Pound closed lower on Monday. The high range close sets the stage for a steady to higher opening when Tuesday's night session begins trading. Stochastics and the RSI are turning bearish hinting that a short term top might be in or is near. Closes below the reaction low crossing at 1.6314 would confirm that a short term top has been posted. If March extends the rally off November's low, monthly resistance crossing at 1.6738 is the next upside target. First resistance is Tuesday's high crossing at 1.6572. Second resistance is monthly resistance crossing at 1.6738. First support is the reaction low crossing at 1.6314. Second support is the reaction low crossing at 1.6203.

The March Swiss Franc closed higher due to short covering on Monday but remains below November's broken uptrend line. The high range close sets the stage for a steady to higher opening when Tuesday's night session begins trading. Stochastics and the RSI are bearish signaling that sideways to lower prices is possible near term. If March extends last week's decline, the 38% retracement level of 2013's rally crossing at .10942 is the next downside target. Closes above the 20 day moving average crossing at .11210 would temper the near term bearish outlook. First resistance is the 20 day moving average crossing at .11210. Second resistance is December's high crossing at .11373. First support is today's low crossing at .11030. Second support is the 38% retracement level of 2013's rally crossing at .10942.

The March Canadian Dollar closed lower on Monday as it extends December's trading range. The low range close sets the stage for a steady to lower opening when Tuesday's night session begins trading. Stochastics and the RSI are neutral to bullish signaling that sideways to higher prices are possible near term. Closes above the reaction high crossing at 94.46 are needed to confirm an upside breakout of December's trading range has been posted. If March renews this fall's decline, weekly support crossing at 92.13 is the next downside target. First resistance is December's high crossing at 94.46. Second resistance is the reaction high crossing at 95.73. First support is December's low crossing at 92.93. Second support is weekly support crossing at 92.13.

The March Japanese Yen closed higher on Monday as it extended the short covering rally off last week's low. The high range close sets the stage for a steady to higher opening when Tuesday's night session begins trading. Stochastics and the RSI are turning neutral to bullish hinting that a short term low might be in or is near. Closes above the 20 day moving average crossing at .9632 are needed to confirm that a short term low has been posted. If March renews the decline off October's high, weekly support crossing at .9421 is the next downside target. First resistance is the 20 day moving average crossing at .9632. Second resistance is the reaction high crossing at .9793. First support is last Thursday's low crossing at .9486. Second support is weekly support crossing at .9421.

Check out our FREE Live Trading Signals Service Trial

Tuesday, August 20, 2013

FMC Market Summary for Tuesday August 20th

The September Dollar closed lower on Tuesday as it extends the decline off July's high. The low range close sets the stage for a steady to lower opening when Wednesday's night session begins trading. Stochastics and the RSI are diverging and have turned bearish signaling that sideways to lower prices are possible near term. If September extends the decline off July's high, June's low crossing at 80.61 is the next downside target. Closes above last Thursday's high crossing at 81.99 are needed to confirm that a short term low has been posted. First resistance is last Thursday's high crossing at 81.99. Second resistance is August's high crossing at 82.61. First support is today's low crossing at 80.77. Second support is June's low crossing at 80.61.

The September Euro closed higher on Tuesday as it extends the rally off July's low. The high range close sets the stage for a steady to higher opening when Wednesday's night session begins trading. Stochastics and the RSI are diverging but have turned bullish signaling that sideways to higher prices are possible near term. If September renews the rally off July's low, the 75% retracement level of the February-July decline crossing at 134.65 is the next upside target. Closes below the 20 day moving average crossing at 133.01 are needed to confirm that a short term top has been posted. First resistance is the 75% retracement level of the February-July decline crossing at 134.65. Second resistance is the 87% retracement level of the February-July decline crossing at 135.84. First support is the 20 day moving average crossing at 133.01. Second support is the reaction low crossing at 131.87.

The September British Pound closed higher on Tuesday as it extended the rally off July's low. The high range close sets the stage for a steady to higher opening when Wednesday's night session begins trading. Stochastics and the RSI are overbought but remain neutral to bullish signaling that sideways to higher prices are possible near term. If September extends the rally off July's low, June's high crossing at 1.5743 is the next upside target. Closes below the 20 day moving average crossing at 1.5425 would confirm that a short term top has been posted. First resistance is today's high crossing at 1.5695. Second resistance is June's high crossing at 1.5743. First support is the 20 day moving average crossing at 1.5425. Second resistance is the reaction low crossing at 1.5200.

The September Swiss Franc closed higher on Tuesday as it extended the rally off July's low. The high-range close sets the stage for a steady to higher opening when Wednesday's night session begins trading. Stochastics and the RSI have turned bullish signaling that sideways to higher prices are possible near term. If September extends the rally off July's low, June's high crossing at .10962 is the next upside target. Closes below last Thursday's low crossing at .10644 would confirm that a short term top has been posted. First resistance is today's high crossing at .10936. Second resistance is June's high crossing at .10962. First support is last Thursday's low crossing at .10644. Second support is the reaction low crossing at .10555.

The September Canadian Dollar closed lower on Tuesday. The low range close sets the stage for a steady to lower opening when Wednesday's night session begins trading. Stochastics and the RSI are neutral to bearish signaling that sideways to lower prices are possible near term. Closes below the reaction low crossing at 95.64 are needed to confirm that a short term top has been posted. If September renews the rally off August's low, July's high crossing at 97.49 is the next upside target. First resistance is July's high crossing at 97.49. Second resistance is the 75% retracement level of the May-July decline crossing at 98.17. First support is the reaction low crossing at 95.64. Second support is the reaction low crossing at 95.52.

The September Japanese Yen closed higher on Tuesday. The high range close sets the stage for a steady to higher opening when Wednesday's night session begins trading. Stochastics and the RSI are neutral to bearish signaling that a short term top might be in or is near. Closes below the 20 day moving average crossing at .10217 would confirm that a short term top has been posted. If September renews the rally off July's low, June's high crossing at .10669 is the next upside target. First resistance is the reaction high crossing at .10440. Second resistance is June's high crossing at .10669. First support is the 20 day moving average crossing at .10217. Second support is the reaction low crossing at .10002.

"How to Beat the Market Makers" >....with options guru John Carter. Only a few hours left to sign up, do it now!

Thursday, April 11, 2013

New, Free Futures Trend Jumper Strategy, the Dow eMini (YM)

Many of you are just beginning to get your FREE Trend Jumper up and running. Hopefully you were able to catch today’s winner that occurred right out the gate this morning. It ended with + 32 points using the three position approach.

Single Position Traders; + 13 points
Two Position Traders; + 31 points
Three Position Traders; + 32 Points

See Today’s FREE Trend Jumper Dow eMini Futures Trade 


Our other FREE Trend Jumper ‘module,’ the EURUSD Swingtrade, has a trade setting up as well. A setup seems imminent but we don’t know if it will trigger in or cancel. We’ll just need to watch it and remain patient and disciplined. 


Full Version Trend Jumper Owners have been treated to a multi session winning streak on many of our favorite markets.

Today was FED Minutes and Crude Oil Inventory Day so it is always good to lower your expectations a bit, trade less and get to your profit goals as quickly as possible. Like we teach in our Live Traderoom, if we can get to our signature ‘power of quitting’ goals early, we’re going to take advantage of the opportunity. And, staying on point with our ‘scalping’ theme (did you see the video in the earlier post?), many trades were quick to finish today.

Crude Oil Futures ended with two trades today for + .32, $320. Heating Oil Futures hit its target on the nail, + 37 ticks, $155 (One and done in 5 minutes.) Unleaded Gas Futures; + 124 ticks, $520 (One and done, 40 minutes)

There were lots of other strong finishes today in the futures world of daytrading, too. But how about our forex trades. There is a lot of action on that front as well. Here’s a look at a few highlights:

NZDUSD is up Hundreds of pips in just a few days — see screenshot
Yen Crosses are heading higher
Aussie crosses are in a variety of profitable trades hitting early targets
GBPUSD is still going strong
NZDCAD just hit a big profit target, + 185 pips to the 1st target and on the way higher

I trade daily charts and only spend a few minutes per day placing and managing these trades. There is NO better way to trade Forex, in my humble opinion. Moreover, there is no better way to stay out of the way of your trading and to just let the tradeplan do its thing. That IS one of the big secrets to success in this business. Once a day, then stay outta the way!!

One of our Current Forex Trades, NZDUSD 


It's not to late to get caught up....Sign up for Trend Jumper today!