The reality is, the world is in a whole mess of debt and it's all coming due at the same time.
Make no mistake about it, the situation in Europe is dire. The problems with Greece are well known. The problems in Spain are growing, and the problems in Ireland and Portugal are about to rear their ugly heads.
We are not going to rhapsodize about the problems in Europe, they are well known and are manifesting themselves in the price action of the world markets, however, in this short video on the euro we want to show you how monthly charts and our "Trade Triangles" tell the story and show the trend very clearly. We also show you a simple method that you can use in your everyday trading to estimate how far a move can go.
My hope is that this new video will highlight some of the reasons why we believe we could be seeing some strong opportunities in this market.
Just click here to watch the video and as always it is available for viewing now and there is no charge or registration requirement. Please feel free to leave a comment and let us know what your thoughts are on the video and the future of the Euro.
As everyone in the Western World knows, Europe has been having its share of major problems. All of Europe’s trials and tribulations have had a dramatic affect on the performance of the euro, recently putting it under severe pressure.
Unlike the United States, where we can print money and inflate ourselves out of most problems, the Eurozone is accountable to the 16 nations who gave up their own currency to join.
In our latest video we'll explain how our "Trade Triangle" technology has been very accurate since the beginning of the year for the euro. Although we've nailed the market thus far, it leads to the big question: Have we seen the euro bottom out?
We hope our new video answers that question and highlights some of the reasons why we believe we could be seeing some strong opportunities in this market.
As always the new video is available for viewing now and there is no charge or registration requirement. Please feel free to leave a comment on this video and where you think the euro is headed.
Last week was amazing for both gold and index traders as gold surged higher and the SP500 tested a key resistance then fell 4% in our favor. The past couple weeks with the mini market crash and Euro issues making the market extra volatile both gold and the broad market (SP500) index has been wild. The added volatility makes trading more difficult because price patterns become less predictable and price movements are much larger increasing risk for traders.
Below are the charts & videos of what to look for in the coming days…
SPY – SP500 Index ETF Trading Chart
This chart clearly shows what I think is about to unfold by looking at the past market drop. Because of the mini market crash triggering everyone’s stops already I figure we have made the low and the dip we are seeing now will drift down a few more percentage points then bottom out.
ES M0 – SP500 Mini Futures Trading Setup – Pre-Drop
Below is a chart of the SP500 which we shorted or bought the SDS bear etf trading fund last week looking to profit from a falling stock market. As you can see from the chart we saw the es mini contract drift into a key pivot point on light volume. What this means is that a large group of sellers will be waiting at that price, and because volume is light we know there are not many buyers at this price level. Simple supply/demand comes into play with more sellers causing the price to stop rising and eventually force the price lower which is what we were anticipating.
The green arrows show key support levels on the 60 minute chart where 1/3 of a position should be taken of the table to lock in gains which also reduces overall risk on the trade. Once we cash in the first 1/3 of the position we move our protective stop the breakeven which is the entry point for the remaining portion of our position. This turns the trading into a winner no matter what happens allowing us to enjoy the ride…
ES M0 – SP500 Mini Futures Trading Setup – Current Price
Here is the same chart 24 hours later showing both of our profit targets triggered pocketing 2/3rds of our position for a very nice gain. Depending on the type of trading vehicle you traded there was potential to make up to 150% return in less than 24 hours.
We currently hold 1/3 of the position left with a loose stop allowing the trade to mature incase the down trend continues for several days or weeks. If not and the price rallies then our stop will get triggered for small profit on the balance of the position. Either way we win.
Stock Market ETF and Futures Trading Conclusion:
In short, the market is trading on increased volatility making it difficult to find low risk setups. At the moment we are long gold and short the SP500 with both position deep in the money. All we can do now is manage our positions to make sure we maximize our profits.
As we all know, last weeks stock market blip/mini crash was very emotional for those of you watching or trading it live. A lot of money changed hands last week and you either lost a bundle or made a bundle…
I did send out some charts and a video on Thursday night about the market crash/recovery if you have not seen it. It’s called “Stock Market Micro Intraday Crash Shows Us Where The Safe Havens Are”.
Below are my ETF charts for the commodities and index I actively follow and trade.
GLD – Gold Bullion ETF – Daily Chart GLD is a great ETF to trade as it generates 10-20 quality low risk setups each year for subscribers. The chart clearly shows the large rally in late 2009 and the correction as it formed patterns moving from a down trend – base – and back to an uptrend.
$USD – US Dollar Index – Monthly Chart This weekly chart I think shows some serious potential for gold and silver prices. The US Dollar is now trading at a key resistance level which I think it will have a tough time moving higher. The dollar has been moving up for several months and looks ready for a pullback or at least a pause. If the dollar starts to roll over in the next few months then we should see gold and silver move substantially higher.
SLV – Silver Bullion ETF – Daily Chart Silver like gold bounced off a key support level last week as investors started to buy silver as a safe haven. Gold moved up sharply on the day of the intraday market crash while silver traded sideways for a day before joining the party. The following day investors starting buying up silver because it was lagging its big sister “yellow Gold”.
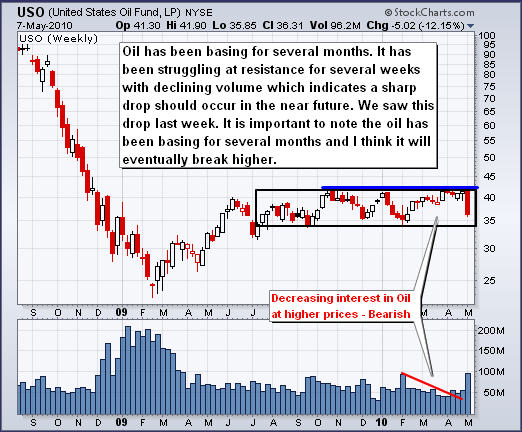
USO – Oil Fund – Daily Chart Several weeks back I posted this chart showing how volume was drying up as oil tested resistance on declining volume. This indicated to us that once/if the price started to roll over it would trigger a sharp sell off as short term traders who bought in anticipation of a breakout to the up side sold out of their positions once support was broken. This is what caused the heavy volume and sharp price drop.
SPY – SP500 INDEX Trading ETF – Daily Chart It’s tougher now to read the index charts as last weeks heavy volume market crash could be seen in two very different ways…
One – We are starting a correction and had a jump start with the human error of selling billions of dollars worth of investments instead of millions prematurely pushing pulling the market down to a level where I think it should/will test again before moving up.
OR Two – This extremely heavy sell off is just the start of what is to come....
Since the government owns the largest banks and the banks are unloading/selling massive amounts of shares calling it an error how do we know it’s not a scam for them to completely short the market in anticipation for a collapse which would make them unheard of amounts of money as the market drops… It is tough to trust anyone sitting up there in those power positions after everything they have been caught for already…
I personally think we could see lower prices in the coming month then the market will bottom and we will see new highs for 2010.
Weekend Commodity & Index ETF Trading Strategy Conclusion: Stepping back and looking at the above charts it looks as thought we could see stocks and commodities digest the recent moves. In short, gold and silver have rallied strong and now trading near resistance. Oil dropped last week and is now trading near a key support level. I feel it the market will trade sideways and stabilize before for a while as the SP500 had that crazy drop last week and now the market is in shock. I figured it would see 3-4 weeks to reach those prices yet it happened in 1 day so now the market could do very little for 3-4 weeks…
The US dollar is something we will be watching more closely because it’s trading at key resistance level. In the past it has taken a month or two for a rally to roll over and head back down. This could play out very nicely if the dollar tops and the rest of the market trends sideways to digest the recent moves. Once the dollar starts to fall it will provide fuel for the next rally in both stocks and commodities.